Building Stronger Communities: Insights from Local Economic Development Efforts in San Ysidro
Featured photo credit: Laser1987 on iStock.
Executive Summary
Times of crisis often expose and deepen longstanding vulnerabilities in under-capitalized communities, leaving many without access to critical resources. In response to the COVID-19 pandemic, community-based organizations (CBOs) across the U.S. quickly mobilized to meet the urgent needs of vulnerable community members.
This case study examines the impact of the COVID-19 pandemic on residents and businesses in San Ysidro, a neighborhood at San Diego’s southern edge and adjacent to the international border with Mexico. It also explores how San Ysidro CBOs mobilized to meet immediate needs while building toward long-term empowerment and local ownership.
San Ysidro is a working-class, majority-Latino neighborhood known for its strong cross-border ties, cultural vibrancy, and proximity to the San Ysidro Port of Entry, the busiest U.S. land border crossing. Its residents have faced elevated air pollution, underinvestment in infrastructure, and physical and political distance from local policymaking. San Ysidro also boasts a vibrant binational economy built on entrepreneurship and cross-border relationships.
To study San Ysidro, we used quantitative and spatial data analysis, paired with historical research and three in-depth interviews with staff from Lifeline Community Services, the Metropolitan Area Advisory Committee on Anti-Poverty (MAAC), and Casa Familiar, three Latino-serving CBOs active in the neighborhood. Although limited in number, the interviews provide valuable practitioner insight to contextualize the data.
Using quantitative and spatial data, we find:
- Disproportionate COVID-19 cases and deaths: As of the latest available data, COVID-19 case rates in San Ysidro were nearly double the countywide rate, while COVID-19 death rates were more than triple the county average—among the highest in the region.
- Business continuity during the pandemic: Although San Ysidro experienced slower business growth than the county between 2019 and 2023, fewer of its businesses closed. This suggests a local business environment that is sustained by the longevity of established businesses.
- Unequal access to federal relief: San Ysidro businesses received just $2,300 per job and $510 per resident in Paycheck Protection Program (PPP) funds, less than half the per-job and per-resident amounts received countywide. This is in line with previous LPPI research, which found that California Latino neighborhoods received less PPP dollars per resident than white and Asian neighborhoods.1
Our historical research and interviews underscore several strategies that contextualize these findings:
- Community-led crisis response fills gaps left by formal systems. In the face of compounding challenges, San Ysidro CBOs and leaders mounted multi-sector collaborations to deliver vaccines equitably, provide direct financial and in-kind aid, and care for unaccompanied migrant children seeking asylum. Their collaborative efforts demonstrated how trust-based, culturally-attuned leadership can fill gaps left by formal systems.
- Cross-sector partnerships drive effective aid. Local CBOs such as MAAC, SBCS (formerly South Bay Community Services), and Casa Familiar worked with public agencies and philanthropy to deliver culturally specific support, from sheltering unaccompanied minors to distributing cash assistance to households excluded from federal aid.
- Community-rooted policy leadership matters. Leaders with a deep understanding of and accountability to their communities can reshape priorities and direct resources where they are most needed. Local leaders’ advocacy ensured vaccine distribution prioritized hard-hit communities like San Ysidro. By 2023, the community had the highest vaccination rate of any San Diego County zip code.
- Long-term equity requires integrated strategies that link economic inclusion to community health, culture, community networking, and coalition building. San Ysidro CBOs continue to integrate health, affordable housing, environmental resilience, and cultural infrastructure to to ensure development supports community wealthbuilding and resident stability, rather than uprooting longtime residents.
For San Ysidro’s Latino leaders, meaningful economic participation begins with community health: access to clean air, healthy bodies, stable housing, caring for neighbors, understanding the interdependency of communities on both sides of the border, and culturally-attuned aid. San Ysidro CBOs offer a generative model to reimagine economic development, where equity and long-term economic impact are embedded in the everyday work of community institutions. The takeaway for policymakers, philanthropists, and researchers is clear: invest in San Ysidro CBOs not as a problem to solve, but as co-creators of a just future.
Introduction
Times of crisis often expose and deepen longstanding vulnerabilities in under-capitalized communities. During the COVID-19 pandemic, historically disinvested communities experienced disproportionate business closures,2 unemployment,3 and housing instability levels.4 San Ysidro, a majority-Latino neighborhood in San Diego, California, exemplified these patterns, having long faced poverty, disinvestment, and environmental challenges.
In response to the pandemic, Latino-led organizations in San Ysidro, San Diego, and across the U.S. quickly mobilized to fill governance and service delivery gaps and meet the critical needs of vulnerable members, particularly those excluded from or unable to access government relief programs such as PPP.5 From launching mutual aid networks to provide food and medicine, to creating emergency relief funds for small businesses and culture bearers, these organizations demonstrated ingenuity and commitment to community well-being. However, few studies have sought to tell the stories of the community-based efforts that sustain communities through crises. This brief combines quantitative data and cultural narratives to highlight Latino-led, community-driven responses that address both crisis and long-term empowerment.
About this Case Study
This case study is part of a series documenting Latino-led Economic Development (LLED) efforts. We define LLED as community-rooted strategies that foster economic resilience and justice through advocacy, education, access to capital, and cultural preservation initiatives. Latino leaders and organizations lead LLED efforts to ensure equitable participation and influence. These efforts are often rooted in the belief that communities can shape their economic futures through grassroots solutions centered on their cultural values and needs while fostering economic self-sufficiency.
In San Ysidro—a longstanding Latino neighborhood in San Diego, California—LLED strategies emerged as vital responses to the compounding challenges of disinvestment, disconnection, and the COVID-19 pandemic. This case study examines how community-led efforts in San Ysidro delivered immediate relief through collaboration, direct aid, and cultural organizing while laying the foundation for long-term empowerment and local ownership.
To study San Ysidro and San Diego’s community-led interventions, we utilized quantitative and spatial data analysis, supplemented by historical analyses and in-depth interviews of three established nonprofit leaders in San Diego. We draw on interviews with Lisette Islas, CEO of Lifeline Community Services and former Executive Vice President of the Metropolitan Area Advisory Committee on Anti-Poverty (MAAC);6 Arnulfo Manriquez, CEO of MAAC;7 and Georgette Gómez, former San Diego City Council President and current Community Development Officer at Casa Familiar.8 These practitioners offer personal perspectives and deep institutional insight, grounded in their leadership of regionally impactful organizations supporting economic resilience and community well-being across systems.
While limited in number, these interviews provide valuable practitioner perspectives that help contextualize our findings, especially when interpreted alongside longitudinal demographic and environmental data (see Appendix for additional details on methodology).
Traditional economic development often relies on top-down solutions and overlooks cultural and local knowledge, often leading to displacement and gentrification under the guise of revitalization. In contrast, community-led strategies in San Ysidro empower the local informal economy, strengthen cooperative networks, and build tailored resources, paving the way for sustainable, community-centered growth for generational residents. These interventions support entrepreneurs, strengthen informal networks, and address socioeconomic disparities.
San Ysidro’s History: Border Connections, City Disconnections
Before European colonization, the Kumeyaay people lived in the Tijuana River Valley as skilled horticulturalists, fishers, and environmental stewards.9 Due to its geographic distance from central settlements such as the San Diego Mission, the area remained largely untouched under Spanish and later Mexican rule. Following San Ysidro’s incorporation into the United States, the 1885 arrival of the Southern California railroad accelerated development. The railroad connected San Ysidro—then known as Tía Juana City—to larger national networks. During this period, the border was fluid and mostly unfenced, and daily life for residents was often binational.10 Many of San Ysidro’s 500 residents crossed to Tijuana daily to work in the city’s racetracks, bars, and casinos.11
The end of Prohibition in the 1930s—combined with changes in Mexican property and gambling laws—caused a decline in Tijuana’s racetrack and casino economy. As Anglo workers and business owners left the region, Mexican families who worked in the United States purchased many of their homes, especially as the Bracero Program increased economic activity and border crossings through the 1960s.12 In 1957, San Ysidro residents successfully petitioned to be annexed by the City of San Diego, hoping to secure better access to municipal water and services. However, the physical separation from the rest of the city left many residents feeling overlooked.13
The most dramatic neighborhood changes came with freeway construction during the 1960s and 70s. Interstates 5 and 805 were expanded to improve access to the border, but the construction also split the community in two and bulldozed hundreds of homes and businesses, including two hundred homes in old San Ysidro.14 While the new infrastructure solidified San Ysidro’s role as a key port of entry, it also erased much of the original neighborhood and disrupted community life.
Neighborhood Conditions in San Ysidro Today
Today, San Ysidro marks the southern edge of San Diego City and is adjacent to the border with Mexico. It is a binational gateway and a historically Latino community known for its strong cross-border ties, cultural vibrancy, and proximity to the San Ysidro Port of Entry—the busiest U.S. land border crossing.15 The neighborhood is also crosscut by three freeways—interstate 5, 805, and 905. The dashed polygons in Map 1 indicate the community plan area while the blue indicate the Census tracts used to provide demographic and socioeconomic context in this report.
Map 1. San Ysidro Neighborhood Boundaries and Census Tracts Used in Analysis
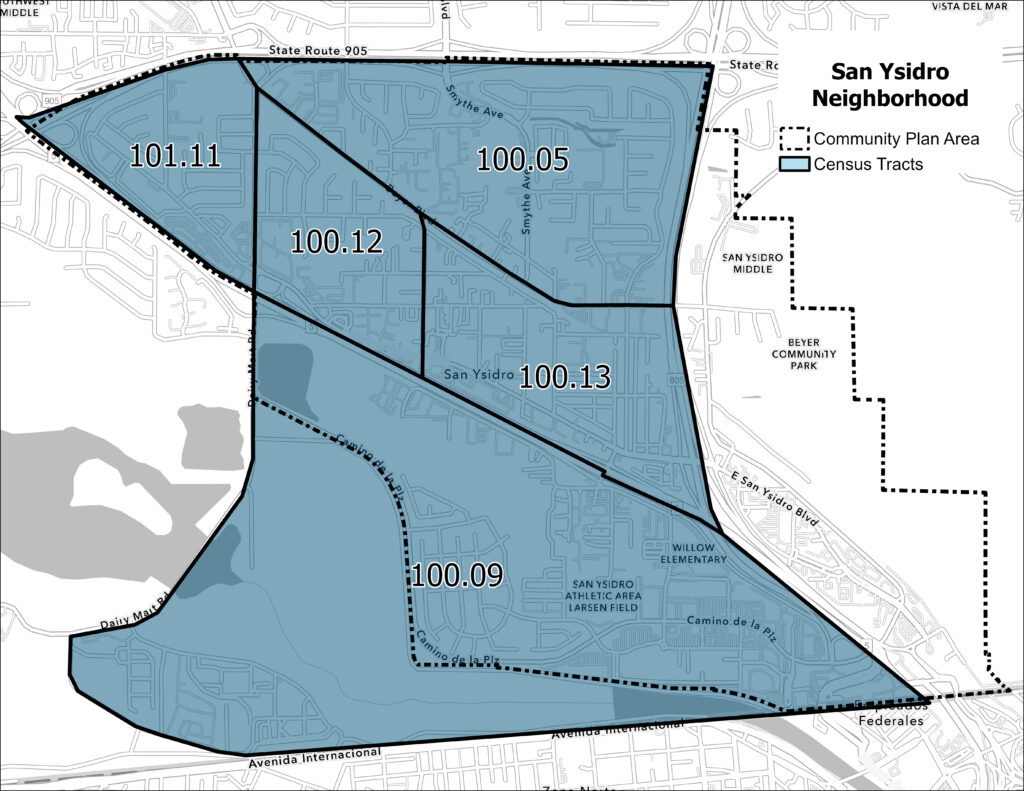
Source: U.S. Census Bureau, 2020 Cartographic Boundary Shapefile.
Commenting on the border’s role in local culture, Lisette Islas discusses how the fluidity defines what it means to be Latino in San Diego:
“We have this artificial border, but there is a lot of blurring of lines of what it means to be an American or a Mexicano living in this region. We have a culture and a society of our own, where [the border is] super fluid…Our lived experience is that [Mexico] is not another country, it is an extended part of the region in which we live. So that has implications for the economy, and that has implications for our day to day experience of what it means to be a Latino or Latina living in the United States.”
A. Demographics Shaped by Cross-Border Community
The next section describes the demographic patterns that shape San Ysidro. Data patterns highlight the importance of community strategies that prioritize linguistic access, cultural representation, and equity in service delivery. Cultural fluency is not only a matter of identity but also a strategic foundation for economic and social sustainability in San Ysidro.
Almost all of San Ysidro’s 25,000 residents identify as Latino (92%; Table 1)—nearly three times the share in the City of San Diego City (30%) and County (34%). Conversely, San Ysidro is home to few Asian and white residents (2% and 3% respectively), especially compared to the broader city and county demographics.
A closer look at San Ysidro’s Latino population reveals that they are almost exclusively of Mexican descent. Approximately 98% of San Ysidran Latinos are of Mexican descent (Table 1), 14 percentage points higher than at the city level (84%) and 12 percentage points higher than at the county level.
Table 1. San Ysidro Racial and Ethnic Composition, 2023
Note: Latinos can be of any race. All other groups reflect the non-Latino/non-Hispanic population.
Source: LPPI analysis of 2023 5-Year American Community Survey Table B03002, available online and Table B03001, available online.
In San Ysidro, almost one quarter of residents are not citizens (23%; see Table 2), more than double the rate for the city (10%) and county (9%). In total, about half of San Ysidrans are immigrants to the U.S. (47%) and the share of immigrant and noncitizen Latinos is consistent with San Ysidro’s overall population.
Additionally, San Ysidro households are over four times more likely to speak Spanish at home than city and county residents (Table 2). About 29% of households are Spanish-speaking and have limited English proficiency—meaning no household member speaks English “very well”16—nine times the city and county rate (3% for both).
Table 2. San Ysidro Population by Nativity and Households by Language
Note: Limited English proficient households are defined by the U.S. Census Bureau as those in which no member 14 years or older 1) speaks only English or 2) speaks a non-English language and speaks English “very well.”
Source: LPPI analysis of 2023 5-Year American Community Survey Table B05001, available online; Table B05003I, available online; and Table C16002, available online.
San Ysidro residents have much lower levels of formal educational attainment compared to both the city and county (Figure 1). Over one third (37%) of San Ysidro residents did not complete high school, more than triple the rate for San Diego City (10%) and County (11%). Conversely, only 11% of San Ysidrans completed a bachelor’s degree or higher, compared to half of city and 42% of county residents.
Figure 1. Educational Attainment for the Population Ages 25 and Older in San Ysidro, 2023
Source: LPPI analysis of 2023 5-Year American Community Survey Table B15003, available online.
B. Income and Wealth Disparities in San Ysidro
San Ysidro has struggled with persistent housing and income disparities compared to the city and county. For example, San Ysidro households earn substantially lower median incomes ($65,400; see Table 3) than the city ($104,300) and county ($102,300). Median household incomes in San Ysidro are only 63% of the city median and 64% of the county median, highlighting a significant income gap compared to the broader region. While the median gross rent in San Ysidro ($1,587) is lower than in the city and county, it still strains household budgets given the area’s lower income levels.
Compared to the city and county, the homeownership rate is lower in San Ysidro. Just 34% of households own their homes, while 66% are renters. This high renter share suggests that more residents may face housing insecurity or have fewer opportunities to build wealth through homeownership.
Table 3. Homeownership and Income Indicators for San Ysidro, 2023
Source: LPPI analysis of 2023 5-Year American Community Survey data.
In light of affordability and income challenges, San Ysidro leaders point to deep community ties as a key strength undergirding the community. Georgette Gómez, community development officer at Casa Familiar, explains how building trust within tight community ties can lead to successful partnerships with community organizations: “[Some] community members have been here for a long time, and you know who those community members are, and they know each other. There is a sense of tightness from a community perspective, and I think that’s one [its] strongest assets…And if you can build relationships, and they can see that you’re in it for the right reasons, then you can do a lot of good.”
C. Environmental Neglect at the Border Catalyzes Activism
Challenges in accessing economic opportunity are compounded by health and environmental risks, such as disproportionate exposure to air pollution. With three freeways crossing the neighborhood and over 14 million passenger vehicles crossing through the port of entry a year17—and many idling for hours—the neighborhood and its residents experience high exposure to both Particulate Matter (PM) 2.5 and Diesel PM.18
In San Ysidro, PM2.5 levels are nearly 50% higher than the county average, while Diesel PM exposure is twice as high as the county average (see Table 4). Approximately 41% of neighborhood residents live within 500 feet of a pollution source.19 Environmental exposures coincide with elevated health burdens: asthma rates across all San Ysidro Census tracts are 68% to 78% higher than the statewide average, and asthma hospitalization rates in the broader South Bay region are roughly 1.5 times higher than the county average.
These elevated pollution levels contribute to San Ysidro’s designation as a disadvantaged community (DAC) under Senate Bill 535, enacted in 2012, which directs a portion of California’s cap-and-trade revenue to communities with elevated environmental and socioeconomic burdens. Under SB 535, three out of five tracts in the study area are DACs.20
San Ysidro’s designation as a DAC is the result of local CBO advocacy, as Georgette Gómez noted that early versions of CalEnviroScreen did not accurately reflect air quality in San Ysidro. Casa Familiar pushed for better data collection and in partnership with the California Environmental Protection Agency (CalEPA), academic institutions, and community members, Casa Familiar installed low-cost air monitors throughout the neighborhood, documenting pollution hot spots, arming residents with data, and garnering a DAC designation for San Ysidro.21
Beyond empowering local environmental advocates with data, the project has also catalyzed resident activism. In an interview with UnidosUS, Casa Familiar CEO Lisa Cuestas noted that the research was guided by a resident committee and aimed to foster resident civic engagement in regional sustainability and quality of life issues.22
Table 4. Environmental Indicators for San Ysidro
Note: California’s Senate Bill 535 requires that a portion of proceeds from the state’s Cap-and-Trade Program be directed toward disadvantaged communities (DACs) to address environmental, public health, and socioeconomic burdens.
Source: LPPI analysis of data from CalEnviroScreen 4.0, available online.
D. A Local Economy Anchored by Cross-Border Retail
San Ysidro is home to a vibrant entrepreneurial ecosystem rooted in cross-border commerce. In 2023, the community supported 964 businesses—most of which were microenterprises with nine or fewer employees (71%). The high concentration of small-scale operations reflects a local economy powered by independent entrepreneurs, including family-run retail shops, service providers, and binational vendors.23 Relatively few establishments employed 10 or more workers, underscoring the importance of self-employment, microenterprises, and informal enterprise as drivers of local economic activity in the region.
Retail trade anchors the local economy, accounting for nearly a quarter (24%) of all establishments. This includes small Mexican markets, clothing wholesalers, and other storefronts that cater to both local residents and cross-border shoppers (see Figure 2). The next largest sectors were health care and social assistance (19%) and finance and insurance (8%). Food establishments such as Mexican restaurants, large commercial businesses such as the Las Americas Premium Outlets, and clothing wholesalers compose some of the main commercial outlets. This distribution reflects a local service-based economy centered around everyday needs and binational consumption.
Cross-border flows are essential to business viability and the local economy. According to the now-closed San Ysidro Chamber of Commerce, 95% of small business customers come from Mexico, and many of them arrive through the PedWest pedestrian border crossing.24
Figure 2. San Ysidro Business Industry Mix, 2023
Notes: Industries reflect two-digit NAICS sectors. In 2023, there were 964 total businesses in San Ysidro.
Source: LPPI analysis of 2023 Data Axle data.
Disproportionate COVID-19 Impacts in San Ysidro
The pandemic exposed deep-rooted inequities in health, access, and opportunity in San Ysidro. High infection and death rates were driven by limited health-care access, environmental stressors, and decades of disinvestment.
A. Disproportionate COVID-19 Cases and Deaths in San Ysidro
During the pandemic, COVID-19 deaths in San Ysidro were among the highest in the region (see Map 2). San Ysidro had the highest death rate among all zip codes with available data analyzed (zip code 92173), highlighting the disproportionate COVID-19 burden experienced by neighborhood residents.
During the pandemic, COVID-19 deaths in San Ysidro were among the highest in the region (see Map 2). San Ysidro had the highest death rate among all zip codes with available data analyzed (zip code 92173), highlighting the disproportionate COVID-19 burden experienced by neighborhood residents.
Map 2. COVID-19 Death Rates in San Diego County by Zip Code, as of March 2022
Notes: Data reflects the zip code 92173 for San Ysidro, which includes census tracts 100.05, 100.09, 100.11, 100.12, and 100.13, and two additional census tracts not included in the previous analysis, 110.15 and 101.06.
Sources: LPPI analysis of San Diego County Health and Human Services Agency Summary of Deaths by Zip Code of Residence (March 2022), available online.
Indeed, COVID-19 case rates in San Ysidro were almost twice as high as countywide rates, while death rates were over three times higher (see Figure 3). Based on available data,25 the average case rate in San Ysidro was 56,493 per 100,000 residents, almost twice San Diego County’s rate (30,104 per 100,000). Similarly, COVID-related death rates in San Ysidro were over three times higher at 517 per 100,000 residents, compared to 155 per 100,000 countywide.
Figure 3. COVID-19 Infection and Death Rates
Note: Data reflect zip code-level reporting and latest available data. Zip code 92173 is used for San Ysidro, which aligns closely but does not perfectly match the neighborhood’s full geographic boundaries. Case data are cumulative through June 2023, while death data are cumulative through March 2022.
Sources: LPPI analysis of San Diego County Health and Human Services Agency Summary of Cases by Zip Code of Residence (June 2023), available online; and San Diego County Health and Human Services Agency Summary of Deaths by Zip Code of Residence (March 2022), available online.
Georgette Gómez noted how COVID-19’s disproportionate health impacts on San Ysidro reflected residents’ economic realities, many of whom “needed to go out and work” despite the pandemic. She added, “[many] of these folks work[ed] in service industries and didn’t have the luxury of staying at home.” Additionally, much of San Ysidro is designated a Medically Underserved Area by the U.S. Health Resources and Services Administration, indicating limited access to primary care providers and health-care services.26
B. Local Business Continuity Despite Unequal Access to Federal Aid
The effects of the pandemic extended to all aspects of community life, including the local business landscape. While the pandemic’s effects on health were severe, the economic impacts in San Ysidro tell a more complex story.
Small businesses faced several pandemic-related challenges but remained relatively stable, experiencing less turnover than the county (see Figure 4). Between 2019 and 2023—before and after the onset of the COVID-19 pandemic—San Ysidro experienced slower business growth (10%) than the county overall (12%). During the same time, 29% of businesses in San Ysidro were newly established, while 19% closed, resulting in a business turnover or “churn rate” that was lower than the county average (49% vs. 53%).
San Ysidro’s lower business turnover rate suggests a relatively stable local economy, marked by fewer openings and closures than the broader region. This trend may indicate a steady, if modest, recovery from the COVID-19 pandemic—driven more by the resilience of long-standing businesses than by rapid growth or churn. For example, we identified a shoe retailer and a perfume shop that have operated in the community for 30 and 15 years, respectively.27
Figure 4. Business Dynamics in San Ysidro and San Diego County, 2019 to 2023
Source: LPPI analysis of 2019 and 2023 Data Axle data.
Although our findings suggest longer-term stability and fewer closures, many local businesses have yet to fully recover from COVID-19-era travel restrictions. The PedWest pedestrian border crossing closed in April 2020 and only partially re-opened in January 2025.28 Given the retail sector’s dependence on cross-border shoppers and prominence, COVID-19 travel restrictions severely disrupted San Ysidro’s local economy.
This closure caused major revenue losses for San Ysidro businesses. The San Ysidro Chamber of Commerce estimated that the community experienced $644 million in lost sales revenue and 1,900 job losses between March 2020 and March 2021.29 Further, retail sales were still down 25% by November 2022, 30 and even as of December 2024, retail establishments that catered to cross-border travelers had not seen sales return to their pre-pandemic levels.31
San Ysidro also received far less federal relief through the Paycheck Protection Program than San Diego County (see Figure 5). PPP was a pandemic-era loan program intended to help businesses retain employees. San Ysidro received just $500 per resident and $2,300 per job, compared to $2,700 per resident and $6,000 per job in the county. Further, a Reveal News analysis demonstrated that only 13% of eligible San Ysidro businesses received PPP loans, compared to 95% of businesses in majority-white, North San Diego county tracts in Carlsbad and Poway.32 The data indicate that federal pandemic relief programs did not equitably reach San Ysidro.
Figure 5. Paycheck Protection Program (PPP) Relief Received in San Ysidro, San Diego County, and California
Sources: LPPI analysis of PPP data from U.S. Small Business Administration data (2024), available online. Population data are from the 2017-2021 5-Year American Community Survey. Job data are from the 2019 Longitudinal Employer-Household Dynamics (LEHD) dataset.
Because PPP loans were distributed through the Small Business Administration (SBA), businesses could only access loans through institutions that worked with the SBA. Relatively few Latino-owned businesses in San Diego had preexisting relationships with these lenders, and even those that did were less likely to have their applications approved.33 Lisette Islas, Chief Executive Officer of Lifeline Community Services, explained, “we as a Latino community are so entrepreneurial and yet not fully connected to the mainstream business community.”
This disconnection from the broader lending community meant that many Latino-owned businesses missed out on critical relief.34 Islas described the challenges: “[o]ur businesses were closing down and not accessing the Paycheck Protection Program and the Employee Retention Credits at the same rates that our counterparts were…We had to push and pull and struggle to get that to [Latino businesses] and to get them to fit into the boxes that we were looking for.”
Georgette Gómez concurred, noting how the absence of community representation in federal funding design impacted San Ysidro businesses’ ability to access aid: “You have a community that didn’t have lobbyists [pushing] to make federal funding accessible for them as it was getting deployed. You had to jump so many hoops to get those resources. Our folks weren’t going to jump all those hoops.”
Economic Development in San Ysidro
A. Community Organizations Fill the Gap for a Distant City Hall
Physical and political distance have long shaped San Ysidro’s relationship with City Hall and top-down economic development. Though annexed into the City of San Diego in 1957, the decision was politically contested and physically disconnected. The city connected San Ysidro through a narrow annexation corridor, reinforcing a sense of detachment from the rest of San Diego.35 Despite early promises that annexation would bring improved infrastructure, city services, and greater political representation, tangible investments lagged, fueling frustration and even de-annexation attempts in the 1970s.36
The first official San Ysidro Community Plan was adopted in 1974, following the formation of a local planning committee intended to give residents a voice in land use and development decisions. However, planning outcomes often reflected top-down priorities. That same decade, the construction of Interstates 5 and 805 demolished hundreds of homes and businesses, physically bisecting the neighborhood and disrupting its social and commercial fabric, with little mitigation or compensation provided to community members.37
In the following years, efforts to update San Ysidro’s infrastructure were sporadic and under-resourced. Residents repeatedly called attention to crumbling sidewalks, poor street lighting, and a lack of investment in commercial corridors. In response, the City and local stakeholders developed new planning frameworks to balance economic growth with historic preservation and community needs. One example was the San Ysidro Historic Village Specific Plan, initiated in the 2000s and formally adopted in 2016 to revitalize the community core through walkable design, transit-oriented zoning, and mixed-use development.38
In 2017, San Diego adopted a new Community Plan to replace the outdated 1974 version, incorporating language on climate resilience, environmental justice, and sustainable growth, along with community input. Yet core issues like access to services, economic development, and public space activation remained only partially addressed.
Other public investment models have yet to bring lasting benefits to residents. For instance, one of San Ysidro’s five census tracts is designated as an Opportunity Zone (see Map 3), offering tax incentives for investments in eligible, historically underserved neighborhoods.39 However, San Ysidro residents have yet to benefit from substantial Opportunity Zone investments as it has received the lowest levels of funding among the 50 largest commuting Opportunity Zones.40 Furthermore, research on Opportunity Zones suggests this economic development tool has had minimal impact on residents’ employment, earnings, or poverty,41 and investments tend to favor wealthier, more educated counties.42
Map 3. Federally Designated Opportunity Zones in San Ysidro

Source: U.S. Department of Housing and Urban Development, available online.
San Ysidro’s experience with official planning efforts also reflects a broader pattern: city-led development processes promise revitalization but often fall short of delivering for residents and businesses. For Georgette Gómez, City Hall’s oversight of San Ysidro is connected to the economics of the border: “The City of San Diego has always looked at San Ysidro [and] at the border purely from an economic lens…it’s like an income generator.” As a result, there is a policy disconnect, and decision-makers often cannot see beyond the economics to the community’s infrastructural and environmental challenges.
In City Hall’s absence, community-based organizations such as Casa Familiar have taken the lead on restoring trust, promoting equitable development, and implementing neighborhood-driven initiatives.43 Through community workshops, Casa Familiar listens to local concerns and advocates for their integration and inclusion in public and private development projects. Many neighborhood changes in San Ysidro have resulted from the community’s efforts to advocate for itself and its spaces.44 The disconnection from City Hall has also fueled community activism, as Georgette Gómez notes, “if you’re not vocal about [what happens in San Ysidro], the City of San Diego is not going to hear about it.” These grassroots efforts illustrate San Ysidro’s self-determination and ability to define its priorities, even though city-led planning processes have historically fallen short.
B. Current Lack of Formal Business Support Structures
In the face of COVID-19 business closures, San Ysidro’s small business community faces a shifting landscape with limited formal support. The 2023 closure of the San Ysidro Chamber of Commerce has created coordination, advocacy, and visibility gaps for local entrepreneurs,45 and made it more difficult for local businesses to access resources, training, and recovery funds.46 The loss also reflects a broader pattern of disconnection between San Ysidro’s economic needs and centralized decision-making.47
San Ysidro businesses also directly bear the brunt of federal economic policy. Many local businesses are still struggling with the long-term economic effects of the pandemic-era PedWest crossing closure, as it has yet to fully reopen due to a diversion of personnel from the PedWest crossing to assisting the U.S. Border Patrol.48 For a community whose economy depends on foot traffic from both sides of the border, the partial shutdown has meant fewer customers, reduced hours, and thinner profit margins. International tariffs have only increased costs for merchants and further reduced margins,49 as one business owner described: “An increase in our prices is going to dramatically affect our sales.”50 The cumulative result is a vibrant commercial corridor struggling to regain its footing amid ongoing economic uncertainty.
Despite these challenges, local entrepreneurs remain proactive and have formed an advisory committee to manage the business improvement district (BID) in San Ysidro. While still in the early stages, the committee plans to host workshops on storefront improvement grants, financial literacy, and marketing strategies. Some committee members have emphasized the need to invest BID funds in public safety and pedestrian infrastructure, to protect residents and attract tourism from across the border. However, until they can obtain nonprofit status and secure funding, the structure remains informal, and support remains limited.51
Interventions: Community-Rooted Policy Leadership, Cross-Sector Partnerships for Rapid Response Aid, and Addressing Long-Term Challenges
In the face of compounding crises—from a deadly pandemic to environmental vulnerability—San Diego community leaders drew on decades of community trust and cultural fluency to respond swiftly and collectively. As interviews with local leaders show, these interventions were not created in reaction to the crisis alone, but built upon long-standing networks of trust, cultural resilience, and a shared commitment to economic empowerment.
A. Community-Led, Cross-Sectoral Partnerships Filled Gaps Left by Formal Systems and Delivered Effective Aid
While the COVID-19 pandemic strained San Ysidro’s health systems and economy, it also sparked a wave of community-led care that extended beyond the neighborhood. Alongside service providers, San Diego’s community-based organizations filled urgent service gaps and led during moments of humanitarian crisis.
In the spring of 2021, as a wave of unaccompanied children arrived at the border, federal officials asked San Diego leaders to convert the downtown convention center into an emergency shelter with just days’ notice.52 A coalition of five trusted Latino-serving nonprofits mobilized immediately. As Lisette Islas recalled: “I got a call on Tuesday…we needed to be ready to care for 2,000 teenagers by Saturday…and each organization was [initially] responsible for 250 young people.”
The coalition transformed the site into a trauma-informed care facility in just five days. Over 96 days, they served 1,400 children daily, offering education, creative programming, and emotional support.53 The site became a national model for cross-sector collaboration and culturally responsive care.54 Georgette Goméz noted that the collaborating organizations initially agreed to support without a guarantee of funding from the federal government to respond to an urgent crisis that all five organizations believed in. Lisette Islas emphasized that, “We didn’t see a data point—we saw children with limitless potential. They crossed a continent in pursuit of safety. All we needed to do was give them a chance.”
At the same time as organizations were providing care for unaccompanied minors, they were also working to stabilize San Diego households hit hardest by the pandemic. Arnulfo Manriquez described how MAAC partnered with the County, the San Diego Foundation, and other funders to deliver direct, culturally tailored aid:
“We were literally signing checks to car loans, paying Cox Communications for the internet. Families would send us invoices, and we paid them directly. But this wasn’t just about relief, it was about preserving educational continuity, mental health, and digital equity. We provided laptops and hotspots to all of our high school students who didn’t have internet access at home so they could keep learning. This is the kind of scalable model that should shape future disaster response policies.”
Casa Familiar likewise responded to urgent needs in San Ysidro, developing its own rental assistance fund, deploying trusted promotoras door to door to help residents access vaccines,55 delivering meals, and providing tech support, often in Spanish and without reliance on internet access.56
What set these interventions apart wasn’t just speed or scale, but proximity, trust, and cultural alignment. As Manriquez noted: “We doubled down on our work…[our service population is] about 65 to 70 percent Latino…our whole staff represents or mirrors the communities that we serve.” That alignment allowed MAAC to move quickly and with nuance—expanding drive-through food distribution, ensuring siblings were included in relief efforts, and communicating clearly about testing and vaccine access.57
Representation wasn’t just about immediate relief—it was about preserving educational continuity, supporting mental health, and ensuring digital equity for Latino families disproportionately impacted by the pandemic. In this context, representation wasn’t just optics; it was infrastructure. The systems, relationships, and cultural fluency already in place became a scalable model for nonprofit and government response that should shape how we plan for future disasters. Deep-rooted infrastructure enabled local organizations to respond to shifting needs, from food distribution to digital access to health messaging. Islas commented:
“I don’t think that [MAAC’s] role changed [during the pandemic] because we always saw ourselves as a strong community partner that was responsive to community needs. The strategies we deployed changed, and we really honed in on looking at the day-to-day nuances of what the community needed and how we could deploy existing resources to make those available to meet community needs.”
Manriquez took on the role of Spanish-language messenger, emphasizing the power of culturally responsive outreach: “That was impactful because people did show up differently—where they would not have shown up had they not been hearing the information in their language.”
B. How Community-Rooted Policy Leadership Transformed Local COVID-19 Vaccination Priorities
Although COVID-19 disproportionately impacted San Ysidro, resulting in the highest COVID-19 mortality rates among all San Diego zip codes, community groups and elected officials took action to ensure available resources flowed to the communities with the most need. Community leaders emphasized that new Latino representation in county-level decision-making was critical to shaping priorities and improving outcomes for Latino residents.
Following this shift in leadership, county officials, community organizations, and local business leaders launched the South Bay Equity and Economy Recovery Task Force. The Task Force addressed COVID-19 disparities by ensuring that disproportionately impacted South Bay communities received resources and support,58 including the equitable distribution of vaccines in hard-hit communities like San Ysidro.59 Without their health and well-being, communities would not be able to work, manage their businesses, or lead meaningful lives. MAAC CEO Arnulfo Manriquez noted how Supervisor Vargas re-shaped the county’s COVID-19 relief and vaccination priorities:
“We got our first Latina elected official on the County Board of Supervisors, [and] she came in right during the pandemic…Her voice was loud. Her voice [called] people [to think about] where and even how the vaccines were being distributed, even how and where [COVID-19] testing was happening—who needed it the most? I saw changes in her first and second year in the district, in shaping the county decisions of how they were beginning to spend their money and where they were investing.”
Georgette Gómez added, “[the] new supervisor understood how the community worked [in the] South Bay.” As a result, services were designed with the community in mind. For example, because San Ysidro is primarily Spanish-speaking and many residents face technology and transportation barriers, vaccination efforts were highly tailored to reach vulnerable communities. San Diego County also expanded 211 hotline access for people with technology and language barriers,60 added neighborhood sites to bring the vaccines closer to people’s homes, and rolled out mobile vaccination clinics.61
Additionally, in a collaboration between the County and other trusted community organizations like Casa Familiar and SBCS, county-funded community health workers went door-to-door in vulnerable communities such as San Ysidro.62 These promotoras de salúd provided residents and workers with vaccine information and scheduled vaccination appointments in Spanish and other languages.63 Much of the promotoras’ success was due to trust, as community organizations had well-established relations with residents well before the pandemic.64
The program was a success. By May 2021, San Ysidro had vaccination rates well above the county average.65 As of the last available data, San Ysidro had the highest vaccination rate of all San Diego County zip codes (Map 4). Local leaders credited the program’s success to collaboration between county officials, mayors, and trusted community organizations, and noted the importance of removing barriers like transportation and language access for Latino communities.66
For Georgette Gómez, running a successful migrant shelter primed local community organizations for a successful and equitable vaccine distribution: “The infrastructure that was created to run the convention center was utilized to deploy and get folks to be more engaged in the vaccines.” Collaborating on a common humanitarian emergency bonded the organizations and government agencies, creating an “infrastructure of trust” where organizations could respond quickly to the moment. Gómez added that “the whole infrastructure just happened to be South Bay organizations. It really translated into COVID response.”
Successful vaccination efforts in San Ysidro also highlight the importance of Latino representation in policy and decision-making roles, as the lens Latina/o policymakers bring can quickly improve the well-being of vulnerable Latino communities. Lisette Islas reflected that having a representative from the community at the county level “brought a lens to the work that immediately started changing the number of deaths from COVID for our community.”
Map 4. COVID-19 Vaccination Rates by Zip Code in San Diego County as of March 2023
Source: LPPI Analysis of County of San Diego Health and Human Services Agency data, available online.
C. Community Power-Building in San Ysidro: Past, Present, Future
For over four decades, Casa Familiar has been a pillar of community power-building in San Ysidro. Founded in the early 1970s to provide immigration and social services, Casa Familiar has become a leader in economic justice, environmental resilience, and culturally grounded development. While traditional economic development models often bypass Latino, working-class, and immigrant communities, Casa Familiar’s focus on participatory design has helped ensure that residents—many of whom are Spanish speakers or first-generation immigrants—have a voice in the development shaping their neighborhood.67 Georgette Gómez described Casa Familiar’s work as “always centering community to advance solutions. And [Casa Familiar] responds to what the community is being challenged with at the moment, or at the many moments that come to the community.”
Casa Familiar’s work reflects a holistic strategy that weaves together civic engagement, public health, environmental justice, and culture. Early organizing efforts included pushing for more equitable transportation policies, affordable housing protections, and environmental monitoring near the port of entry. In the early 2000s, the organization began integrating arts and culture into its planning strategies, culminating in an adaptive reuse arts and culture center called The Front, an active art gallery, arts education space, and meeting venue for community residents and artists.68
Casa Familiar has turned its attention to structural solutions in the face of climate change and housing insecurity. In mid-2024, construction began on La Semilla Community Resiliency Center, a multipurpose center designed to serve as a cooling hub during extreme heat, a flood-safe evacuation site, and an education and organizing space for residents facing the daily impacts of climate change. The project also boasts a community garden, greenhouse, micro-mobility garage, and electric vehicle chargers.69
Casa Familiar is also building a community land trust (CLT) named Avanzando San Ysidro, which aims to remove land from the market and preserve affordability for future generations.70 A CLT is an entity that acquires and holds land on behalf of the community and offers residents an opportunity to build wealth through owning a home on the community land. The project will provide residents with the opportunity to buy a deeply subsidized home after renting for 15 years, and is the first in the state to target households earning 30 to 60% of median incomes in a rent-to-own model. As Gómez stated, “If we really are serious about uplifting the quality of life for the community, the only way is for them to have stable housing. That was the whole premise of exploring the community land trust.”
Currently, the Avanzado San Ysidro CLT is developing a 103-unit multifamily, mixed-use affordable housing development.71 Casa Familiar is also working with build trades organizations to train and hire local community members to build new developments, and create economic benefit for community members.72
These projects also reflect Casa Familiar’s broader goal: to institutionalize community control over development and protect San Ysidro from the displacing pressures of gentrification and speculative investment. Georgette Gómez summarized like this, “There’s a lot of speculators coming in, so we’re trying to get ahead of it. As we land bank, we’re securing funding for development, and then we partner with the community to have that community vision and push for community-driven development.”
Casa Familiar also continues to anchor regional collaborations across the South Bay, helping coordinate housing, transportation, and health equity efforts. During the COVID-19 pandemic, it was key in vaccine outreach, information access, and direct relief like rent assistance. Today, Casa Familiar is a leading advocate for cross-sector planning that integrates public health, economic justice, and cultural life into every decision-making stage.
Conclusion: Health, Leadership, the Border, and the Future of Economic Inclusion in San Ysidro
San Ysidro demonstrates the resilience and dynamism of Latino communities in the face of persistent disinvestment. Bisected by freeways and anchored by generations of working-class immigrant families and businesses, it has long been excluded from traditional economic development efforts. Residents face elevated air pollution, underinvestment in public services, and barriers to federal support. Yet San Ysidro has sustained a vibrant binational economy rooted in entrepreneurship and cross-border ties—despite a global pandemic, tariffs, and limited aid—and has forged its own vision for health, dignity, and self-determination.
The link between health and economic opportunity is clear: clean air, healthy bodies, and stable housing are prerequisites for economic participation. The COVID-19 pandemic highlighted both San Ysidro’s vulnerabilities and the central role of community health in economic development. In the first year of the pandemic, the area had the region’s highest COVID-19 mortality rates. In response, community-based organizations partnered with elected leaders to build the language access, information, and support systems needed to reach the hardest-hit residents.
The presence of local Latino leaders—both elected and nonprofit—catalyzed more culturally responsive policy, shifting County priorities toward disproportionately impacted communities, delivering aid, information, and services in culturally attuned ways, and supporting unaccompanied minors. Organizations like MAAC and Casa Familiar immediately stepped into this role, drawing on a deep bench of bilingual, trauma-informed staff already cleared by the state and embedded in the community through longstanding child development and youth programs.
Non-profit staff were not new hires, but experienced educators and support staff who brought trusted relationships, curriculum knowledge, and cultural fluency to meet the urgent needs of unaccompanied minors with dignity and care. Arnulfo Manriquez reflected on the importance of this representation for policy: “Bring the voices of the people to the recommendations, and you will begin to hear different recommendations…Representation matters at all levels.”
In San Ysidro, and San Diego more broadly, the border is central to economic and cultural life. Cross-border flows of goods, labor, and people power the region. Families, students, and small businesses operate across the boundary. When the pandemic restricted movement at the San Ysidro Port of Entry, the local economy came to a halt. Businesses continue to struggle while the PedWest pedestrian crossing remains partially closed.
San Ysidro shows the potential of community-rooted institutions to drive holistic, place-based development, integrating health, affordable housing, environmental resilience, and cultural infrastructure tailored to border communities. For funders, policymakers, and nonprofit leaders, San Ysidro underscores the value of local leadership, cross-sector collaboration, and culturally responsive planning.
As the region moves toward more inclusive economic development, San Ysidro offers a generative model where equity and long-term impact are built into the daily work of trusted institutions. Manriquez put it this way: “None of our work ends with the program itself…It’s not the child. It’s about the family. It’s not about the high school graduate. It’s about where they’re going after.” Lisette Islas agreed, adding, “We are responsible for walking the path alongside [the Latino community] and opening doors to opportunity. They run through those doors and create incredible things…If we provide opportunities that speak to the community, they leverage them to create strong futures for themselves, and they will bring the rest of their community, their family, their network along with them.”
Acknowledgments
The research team extends its gratitude to Sonja Diaz for setting the project’s vision, Alberto Murillo for early literature review support, Jorge Padilla and Bryzen Enzo Morales for research support, and Jared Jimenez for cartography support. We would also like to thank Arnulfo Manriquez of MAAC, Lisette Islas of Lifeline Community Services, and Georgette Gómez for their time and commitment to this project.
Appendix. Methodology and Limitations
We used a mixed-methods approach combining quantitative and spatial data analysis, historical research, and qualitative interviews. The interviews—limited to three nonprofit leaders at three organizations in San Diego County—were not intended to be representative but instead to offer practitioner insight from individuals deeply embedded in the cultural and economic life of San Ysidro. These perspectives helped us interpret the broader data trends and identify locally relevant themes. We acknowledge that the small sample size limits the generalizability of the qualitative findings and invite further study to build upon this exploratory case. Future research should include a broader sample of community voices to deepen and validate the themes identified here.
Interviewers asked community leaders about their organization’s background and mission; strategies and stories of COVID-19 resilience; specific needs, values, or opportunities they see as necessary to building a strong local economy; systemic barriers encountered when trying to implement Latino-centered strategies; lessons on productive Latine leadership, and visions for the future. While not exhaustive, these interviews provided context to interpret the stories underlying the quantitative data and better understand on-the-ground experiences.
Quantitative sources included:
- 2019-2023 American Community Survey (ACS) 5-Year Estimates data on population, race and ethnicity, household income, housing tenure, and rent to describe San Ysidro’s demographics and economic conditions.73
- CalEnviroScreen 4.0 indicators of pollution exposure and environmental risk.
- 2019 and 2023 Data Axle establishment-level data to assess business dynamics pre- and post-COVID-19 pandemic. We calculated business entry and exit rates, net change rates, and churning rates of businesses from 2019 to 2023 to better understand neighborhood business dynamics.
We also gathered data from several historical sources. Historical resources included local news archives and the San Diego City historic context statement for San Ysidro. Lastly, we gathered information on investment zones and designations over time using the archives of the U.S. Department of Housing and Urban Development and the U.S. Department of Treasury Community Development Financial Institutions Funds to investigate the area’s funding and planning history.
End Notes
1 Paul M. Ong, Silvia R. González, Chhandara Pech, Kassandra Hernández, and Rodrigo Domínguez-Villegas, Disparities in the Distribution of Paycheck Protection Program Funds Between Majority-White Neighborhoods and Neighborhoods of Color in California (Los Angeles, CA: UCLA Latino Policy and Politics Institute and Center for Neighborhood Knowledge, December 2020), available online.
See also Silvia González and Rodrigo Dominguez-Villegas, Interactive Map — Disparities in the Distribution of the Paycheck Protection Program in CA (Los Angeles, CA: UCLA Latino Policy and Politics Institute and Center for Neighborhood Knowledge, December 2020), available online.
2 “COVID-19 Impacts on Minority-Owned Small Businesses in California,” UCLA Center for Neighborhood Knowledge, December 2020, available online; Robert Fairlie, “The Impact of COVID-19 on Small Business Owners: Evidence from the First Three Months after Widespread Social-Distancing Restrictions,” Journal of Economics and Management Strategy 29, no. 4 (2020): 727-40, available online.
3 U.S. Small Business Administration, The Impacts of COVID-19 and Racial Disparities in Small Business Performance (Washington, DC: U.S. Small Business Administration, August 2022), available online.
4 Paula Nazario, Silvia R. González, and Paul M. Ong, Latino and Asian Households in California Are Behind on Rent and Behind in Access to State Relief Program (Los Angeles: UCLA Latino Policy and Politics Institute and UCLA Center for Neighborhood Knowledge, April 4, 2022), available online; Shreela V. Sharma, Ru-Jye Chuang, Melinda Rushing, Brittni Naylor, Nalini Ranjit, Mike Pomeroy, and Christine Markham, “Social Determinants of Health–Related Needs During COVID-19 Among Low-Income Households With Children,” Preventing Chronic Disease 17 (October 2020): 200322, available online.
5 Paul M. Ong, Silvia R. González, Chhandara Pech, Kassandra Hernández, and Rodrigo Domínguez-Villegas, Disparities in the Distribution of Paycheck Protection Program Funds Between Majority-White Neighborhoods and Neighborhoods of Color in California (Los Angeles: UCLA Latino Policy and Institute, December 17, 2020), available online.
6 Lifeline Community Services is a community-based human services organization that serves low-income and underserved populations in San Diego County. They provide youth development, child abuse prevention, behavioral health, housing and self-sufficiency, and anti-human trafficking services. For more information, see Lifeline Community Services, “Our Vision and Values,” Accessed August 2025, available online.
7 MAAC has long served as a trusted anchor institution with the capacity, credibility, and infrastructure to lead region-wide responses. Its decades of sustained investment in housing, early childhood education, workforce development, health, and advocacy have positioned it as a central hub for community-centered solutions. During the pandemic, this role became even more evident, as MAAC mobilized cross-sector partnerships, leveraged its multilingual and trauma-informed staff, and filled institutional gaps with speed and cultural fluency. Funders and policymakers alike look to MAAC not only for direct services but for strategic leadership that reflects the lived realities of low-income Latino communities and delivers systems-level impact. For more information, see MAAC, “About MAAC,” accessed July 2025, available online.
8 Casa Familiar, first established in 1968 as Trabajadores de la Raza, is the leading service and community development organization in the community of San Ysidro, providing over 40 bilingual programs and services at six different sites in the community. For more information, see Casa Familiar, “About Us,” Accessed August 2025, available online.
9 Viejas Band of Kumeyaay Indians, “Kumeyaay History,” accessed June 3, 2025, available online; Old Town San Diego Guide, “Original People,” accessed June 3, 2025, available online.
10 Although the border was fluid, the U.S. did begin defining the southern border with Mexico more concretely. By the mid-1860s, 258 temporary markers were erected along the 1,200 mile U.S.—Mexico border between San Diego and Brownsville, Texas. For more detail, see City of San Diego and Page & Turnbull, San Ysidro: Historic Context Statement (San Diego, CA: City of San Diego and Page & Turnbull, March 28, 2011), available online.
11 Fernandez, “San Ysidro’s Historic Customs House and the Tale of Two [Border] Cities” and City of San Diego and Page & Turnbull, San Ysidro: Historic Context Statement.
12 Ibid.
13 Adriana Heldiz, “How San Ysidro Became a Part of the City of San Diego,” Voice of San Diego, May 8, 2019, available online.
14 San Diego Union-Tribune, “San Ysidro/Otay Mesa: A Sense of History and Community Pride,” October 12, 2020, available online.
15 General Services Administration, “San Ysidro Land Port of Entry: Fact Sheet,” December 11, 2019, available online.
16 U.S. Census Bureau, “What Languages Do We Speak in the United States?,” December 2022, available online.
17 Elena Austin, David Flores, Graeme Carvlin, Jeff Shirai, Vanessa Galaviz, Angelica Ruiz, Javier Emmanuel Castillo Quiñones, Zohir Chowdhury, Penelope JE Quintana, and Edmund Seto, San Ysidro Community-Engaged Air Monitoring Study to Inform CalEnviroScreen (San Diego, CA: Casa Familiar, October 2022), available online; Bureau of Transportation Statistics, “Border Crossing Data Annual Release: 2023—2024,” Press Release BTS 10-25, February 18, 2025, available online.
18 The federal standard for PM2.5 is an annual average of 9 µg/m³. There is no state or federal standard for Diesel PM. Diesel PM is a significant component of PM2.5 and is linked to serious health impacts, including respiratory and cardiovascular issues. Exposure to diesel PM has been linked to an increased risk of lung cancer and can worsen conditions such as asthma and chronic bronchitis. While the government regulates PM2.5, Diesel PM is not regulated. Because of their small size, pollutants categorized as PM2.5 are known to cause adverse health effects by penetrating deep into the lungs and bloodstream. Long-term exposure to PM2.5 has been linked to an increased risk of developing asthma in both children and older adults. While PM2.5 is regulated by the government, Diesel PM is not. Diesel PM can originate from a variety of sources, including vehicles, trucks, buses, wildfires and other forms of combustion-related exhaust present in the environment.
19 Maya Srikrishnan, “San Ysidro Is Getting a Clearer Look at Just How Polluted It Is,” The Voice of San Diego, April 23, 2018, available online.
20 CalEnviroScreen 4.0, “Indicator Maps: Asthma,” accessed June 5, 2025, available online; County of San Diego Community Health and Human Services Agency, Public Health Services, Health Statistics Unit, South Region Health Status Report Summary (San Diego, CA: County of San Diego Community Health and Human Services Agency, September 2023), available online.
21 Srikrishnan, “San Ysidro Is Getting a Closer Look at Just How Polluted It Is;” and Hindmon and Ashley Rusch, “Community Land Trusts Preserve Housing and Cultural Identity,” KPBS, September 3, 2024, available online.
22 UnidosUS, “The Untold Border Crisis: How UnidosUS Affiliate Casa Familiar is Tackling Environmental Justice,” July 25, 2019, available online.
23 LPPI analysis of 2023 data from Data Axle.
24 NBC7 San Diego, “San Ysidro Business Community Welcomes Full Return of Cross-Border Travel,” NBC News, November 5, 2021, available online.
25 Figures reflect the zip code 92173 for San Ysidro, which includes census tracts 100.05, 100.09, 100.11, 100.12, and 100.13, and two additional census tracts not included in the previous analysis, 110.15 and 101.06. Countywide rates use official totals. Data reflect the latest publicly accessible data. Case data are cumulative through June 2023, while death data are cumulative through March 2022.
26 Based on a spatial overlay of the San Ysidro area boundary (defined by census tracts) with the U.S. Health Resources and Services Administration’s (HRSA) Medically Underserved Area shapefile, available online.
27 Using Data Axle data, among the 300 businesses in San Ysidro that reported being established for at least a year, the median number of years in business was 7 (established in 2016) and the arithmetic mean was 13 years in business (2010). Additionally, Carolin Shoes on San Ysidro Boulevard has been in business for more than three decades, and Sunny Perfumes on East San Ysidro Boulevard has been operating since 2010. For analyses of local businesses during the pandemic, see Gustavo Solis, “Politicians Lobbied for Border Reopening as San Ysidro Businesses Suffered,” KPBS 65, November 10, 2021, available online; Elizabeth Ireland, “Border Restrictions Put San Diego Businesses, Families in Doubt,” Independent Voter News, September 29, 2020, available online; and Alexandra Mendoza and Wendy Fry, “Immigrants, Hit Hard by the Pandemic, Are Sending Even More Money Back to Mexico,” San Diego Union-Tribune, May 3, 2021, available online.
28 KPBS Public Media, “Impact of PedWest Border Closure on Economy,” San Diego News Now, June 21, 2025, available online.
29 Dan Grossman, “Trouble for Business Owners in the Border Town of San Ysidro, CA,” Indy Correspondent, July 31, 2021, available online.
30 Gustavo Solis, “San Ysidro Businesses Expect Another Subpar Holiday Season,” KPBS 65, November 25, 2022, available online.
31 Perla Shaheen, “San Ysidro Businesses Struggling with Continued Partial Closure of PedWest,” KGTV San Diego, December 5, 2024, available online.
32 Mohamed Al Elew, “Which Neighborhoods Were Neglected by the Paycheck Protection Program?,” Reveal News, May 1, 2021, available online.
33 Ibid; Claire Trageser, “Businesses in San Diego’s Majority White Communities Received By Far the Most PPP Loans,” KPBS Midday Edition, May 3, 2021, available online.
34 Ibid.
35 Kevan Q. Malone, “San Diego’s South Bay Annexation of 1957: Water Insecurity, Territorial Expansion, and the Making of a U.S.-Mexico Border City,” The Metropole, February 21, 2024, available online.
36 Ibid.
37 Ibid.
38 City of San Diego, “San Ysidro Historic Village Specific Plan,” October 2016, available online.
39 We look at Opportunity Zones as one recent measure or aspect of economic development in the United States, but it is not the only vehicle through which place-based investment can be made.
40 Data on census tract-specific investments are not yet available, but research on Opportunity Zone investment shows that San Diego has received the lowest levels of funding among the 50 largest commuting zones. See Appendix Table A3 in Patrick Kennedy and Harrison Wheeler, “Neighborhood-Level Investment from the U.S. Opportunity Zone Program: Early Evidence,” UC Berkeley Opportunity Lab, April 12, 2021, available online.
41 Matthew Freedman, Shantanu Khann, and David Neumark, “JUE Insight: The Impacts of Opportunity Zones on Zone Residents,” Journal of Urban Economics 33 (2023): 103407, available online.
42 Kevin Corinth, David Coyne, Naomi Feldman, and Craig Johnson, “Chapter 7. The Targeting of Place-Based Policies: The New Markets Tax Credit Versus Opportunity Zones,” in The Economics of Place-Based Policies (Chicago, IL: University of Chicago Press, forthcoming), available online.
43 Casa Familiar, “Our Projects,” accessed July 9, 2025, available online.
44 Esmeralda Perez, “San Ysidro Alley Has Caused Safety Concerns, but Changes are Expected to Come,” CBS 8, June 27, 2024, available online.
45 Crystal Niebla, “After ‘Abrupt’ Contract Cutoff, New San Ysidro Group Seeks to Manage Business District,” inewsource, April 14, 2025, available online.
46 Salvador Rivera, “California Border Town Unveils Recovery Plan for Businesses Hurt by Travel Restrictions,” Border Report, August 16, 2021, available online; and Crystal Niebla, “After ‘Abrupt’ Contract Cutoff, New San Ysidro Group Seeks to Manage Business District.”
47 Jason Wells, “Any Successful Recovery Plan Will Look Beyond the Border,” The Voice of San Diego, May 14, 2020, available online.
48 Gustavo Solis, “Partial Closure of PedWest Crossing Still Hurting Cross-Border Economy,” KPBS, December 18, 2024, available online; KPBS Public Media, “Impact of PedWest Border Closure on Economy.”
49 Laura Acevedo, “San Ysidro Business Owners Struggle Amid U.S.-China Tariff Uncertainty,” ABC 10, May 12, 2025, available online.
50 Laura Acevedo, “San Ysidro Business Already Feeling Effects of Tariff Impacts,” ABC 10, April 5, 2025, available online.
51 Niebla, “After ‘Abrupt’ Contract Cutoff, New San Ysidro Group Seeks to Manage Business District.”
52 City News Service, “First 500 Migrant Children Arrive at Temporary Shelter in San Diego Convention Center,” Times of San Diego, March 28, 2021, available online.
53 Kate Morrissey, “What It Was Like Working with Migrant Children Inside the San Diego Convention Center,” The San Diego Union-Tribune, August 9, 2021, available online.
54 EpicShare, “Rapidly Transforming a Convention Center into an Emergency Shelter to Care for Thousands of Children at the Border,” EpicShare, November 7, 2021, available online.
55 Melissa Adan, “Vaccines, ‘Promotoras’ Helped Close Gap in COVID-Related Deaths for California Latinos: Data,” NBC 7 San Diego, July 14, 2022, available online.
56 Ibid; Jesse Pagan, “San Ysidro Nonprofit Casa Familiar Adds Services, Pivots During Pandemic,” CBS 8, available online; Alexandra Mendoza, “Casa Familiar’s Program Allows to Take Hot Meals to Seniors,” San Diego Union Tribune, August 4, 2020, available online.
57 UCLA LPPI interview with Arnulfo Manriquez, December 2024.
58 Lorena González, Twitter post, February 25, 2021, available online.
59 NBC 7 Staff, “San Diego County to Launch South Bay Equity and Economic Recovery Task Force,” NBC 7 News, February 25, 2021, available online.
60 211 San Diego is a resource that helps people find the help they need by connecting them with local health and human service organizations. To learn more visit: https://211sandiego.org/
61 Alicia Summers, “A Vaccination Success in the South Bay,” CBS 8, March 24, 2021, available online;
Jared Aarons, “Vaccine Clinic in San Ysidro Breaks Down Barriers,” ABC 10, April 17, 2021, available online.
62 County News Center, County of San Diego Communications Center, “Distributing COVID-19 Vaccines Equitably,” March 30, 2021, available online.
63 Laura Acevedo, “San Diego County ‘Promotoras’ to Help Make Vaccine Appointments,” ABC 10 News, February 5, 2021, available online.
64 Jennifer Bowman, “Even With Vaccinations, San Diego’s Vulnerable Communities Still Report High COVID-19 Rates,” iNewsource, December 15, 2021, available online.
65 Laura Acevedo, “South Bay One of the Most Vaccinated Regions in the County,” ABC 10 News, October 9, 2021, available online.
66 Ibid; Allison Ash, “South Bay Leading the Way in Coronavirus Vaccinations,” NBC 7, May 24, 2021, available online.
67 San Diego Foundation, “Enhancing our Gateway Community—Forever!,” July 30, 2019, available online.
68 The Front, “Our Gallery,” accessed July 10, 2025, available online.
69 Donald Bloodworth, “San Ysidro Project Will Help People Cope with Climate Change,” San Diego Business Journal, August 29, 2024, available online.
70 Casa Familiar, “Our Projects,” accessed July 2025, available online.
71 Casa Familiar [@casa.familiar], “San Ysidro Community Land Trust Video,” Instagram, December 20, 2023, available online; Hindmon and Rusch, “Community Land Trusts Preserve Housing and Cultural Identity.”
72 LPPI interview with Georgette Gómez, August 18, 2025.
73 We use the following San Diego County census tracts to provide socioeconomic data for San Ysidro: Census Tract 100.05; Census Tract 100.09; Census Tract 100.12; Census Tract 100.1; and Census Tract 101.11.
Featured photo © iStockphoto.com/Laser1987